AlgoVisual
ReactJS project that brings to life path finding and sorting algorithms in computer science.
Inspired by Clement Mihailescu, featuring my implementation using ReactJS instead of vanilla Javascript.
Try it out at: https://algo-visualize.netlify.app/
About
An interactive web application that features:
- Path Finding Algorithms that compute paths between a starting point and a destination point. Users can draw their own graphs before running the algorithms.
- Maze generation using recursive division.
- Sorting Algorithms that arrange a list of integers in ascending order.
- Pausing and adjustment of the algorithm speed to see each execution step.
Path Finding Algorithms
- Depth First Search
- Breadth First Search
- Dijkstra’s Algorithm
- Astar Algorithm (Manhattan Heuristic)
Sorting Algorithms
- Selection Sort
- Bubble Sort
- Quick Sort (Rightmost Pivot)
- Merge Sort
- Gravity Sort
Landing Page
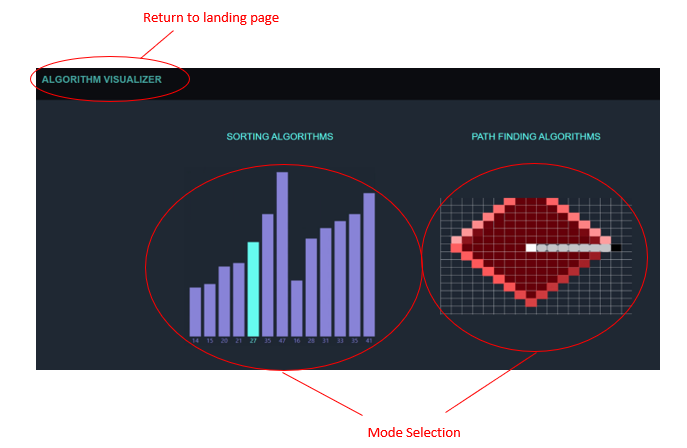
At the landing page, you are presented with two options: Sorting Algorithms and Path-Finding Algorithms. Select by clicking on the gif animation. To return to the landing page, click on “Algorithm Visualizer” located in the leftmost side of the header.
Sorting Algorithms
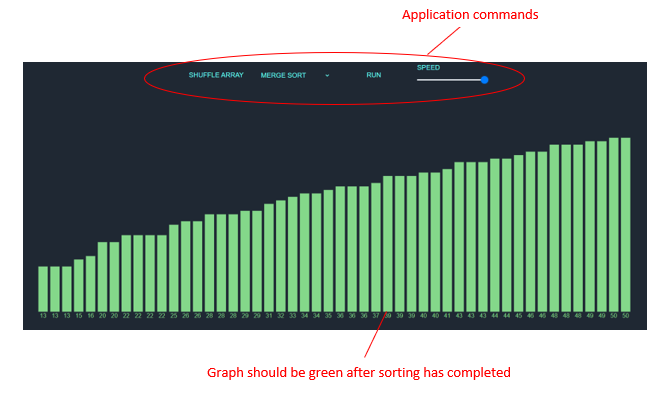
There are 4 main commands in this mode:
- Shuffle Array, generates a list of random integers. This functionality is blocked when an algorithm is running.
- Algorithm Selection, displays a drop down list of algorithms to choose from.
- Run/Pause, after selecting an algorithm, press ‘Run’ to see the algorithm in action. You may pause it at any point of time during algorithm execution.
- Speed, a slider to adjust the speed of the visualization. Slide left to slow down, and right to speed up.
When sorting is complete, the graph should be green in color.
Path Finding Algorithms
In this mode, you have a 25 row by 45 column grid. The grid is representative of a connected graph where each grid cell/node has edges of weight 1 to its top, bottom, left and right nodes.
There are 7 commands for this mode:
- Set Source and Destination Nodes, to change the position of these nodes, drag the node and drop it in the desired position.
- Algorithm Selection, displays a drop down list of algorithms to choose from.
- Graph Augmentation, users can transform nodes to walls by
Left ClickandDragging the mouse cursoracross the nodes. There is a drop down menu to choose betweenNon-Passable WallandWeak Wall. IfNon-Passable Wallis selected, the neighboring nodes (top, bottom, left, right) of the augmented node will no longer have an edge to this node. IfWeak Wallis selected, the edges from the neighboring nodes to the augmented node will have their weights increased from 1 to 50. - Run/Pause, after selecting an algorithm, press ‘Run’ to see the algorithm in action. You may pause it at any point of time during algorithm execution. When the algorithm is paused, the source and destination nodes cannot be adjusted, but graph augmentation is still allowed. During execution, visited nodes are shown in sequence of visit, and after execution, path nodes will be drawn from the source node to the destination node (if there is such path).
- Speed, a slider to adjust the speed of the visualization. Slide left to slow down, and right to speed up.
- Reset, clears all visualization and drawn walls.
- Maze generation, augments the graph using
Non-Passable Wallsto create a maze.
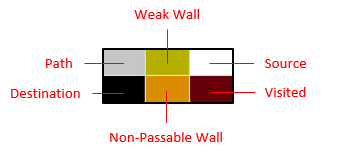
The following diagram depicts the legend for each node type: